Global inventory of continental hydrogen chloride and particulate chloride emissions
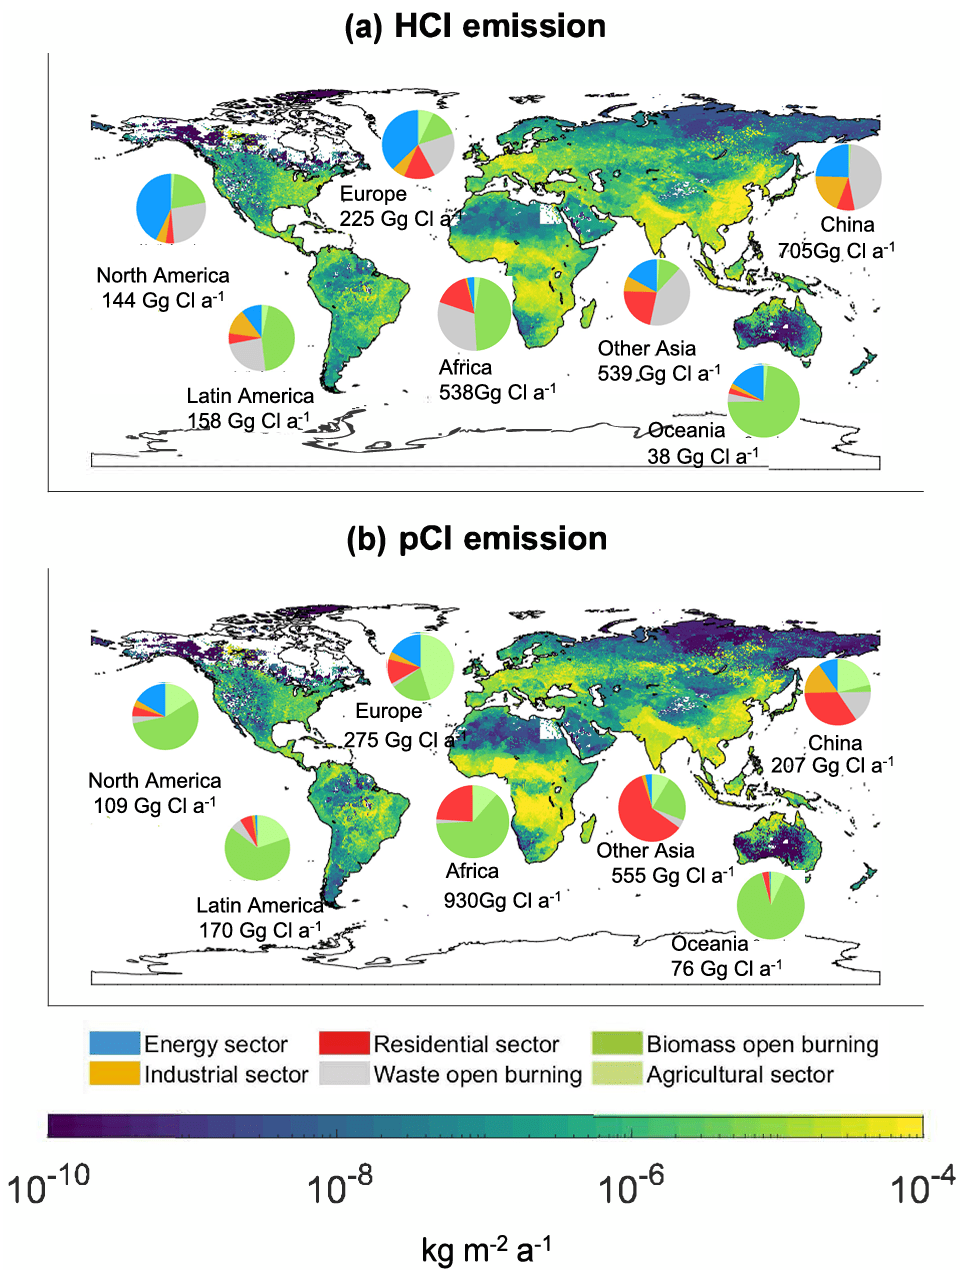
We developed an emission inventory for hydrogen chloride (HCl) and particulate Cl (pCl) from continental sources (GT-Chlorine). This emission inventory contains six source sectors including the energy sector, industrial sector, residential sector, open waste burning, open biomass burning and agricultural sector. The files contain monthly-averaged emission flux of HCl and pCl with the unit of kg m-2 s-1 from each sector. The emissions are gridded at a spatial resolution of 0.1° × 0.1° for the years 1960 to 2014. These data are HEMCO-ready and can be used in Geos-Chem directly. See the related publication and dataset below for more details.
Citations:
Zhang, B., Shen, H., Yun, X., Zhong, Q., Henderson, B. H., Wang, X., Shi, L., Gunthe, S. S., Huey, L. G., Tao, S., Russell, A. G., Liu, P*., Global Emissions of Hydrogen Chloride and Particulate Chloride from Continental Sources. Environmental Science & Technology, 56, (7), 3894-3904, 10.1021/acs.est.1c05634, 2022.
Zhang, B., Liu, P*., Shen, H., Yun, X., Zhong, Q., Henderson, B. H., & Tao, S. (2022). Global Emissions of Hydrogen Chloride and Particulate Chloride from Continental Sources (GT-Chlorine) Harvard Dataverse. https://doi.org/doi:10.7910/DVN/23BRII

Complex refractive indices of SOA
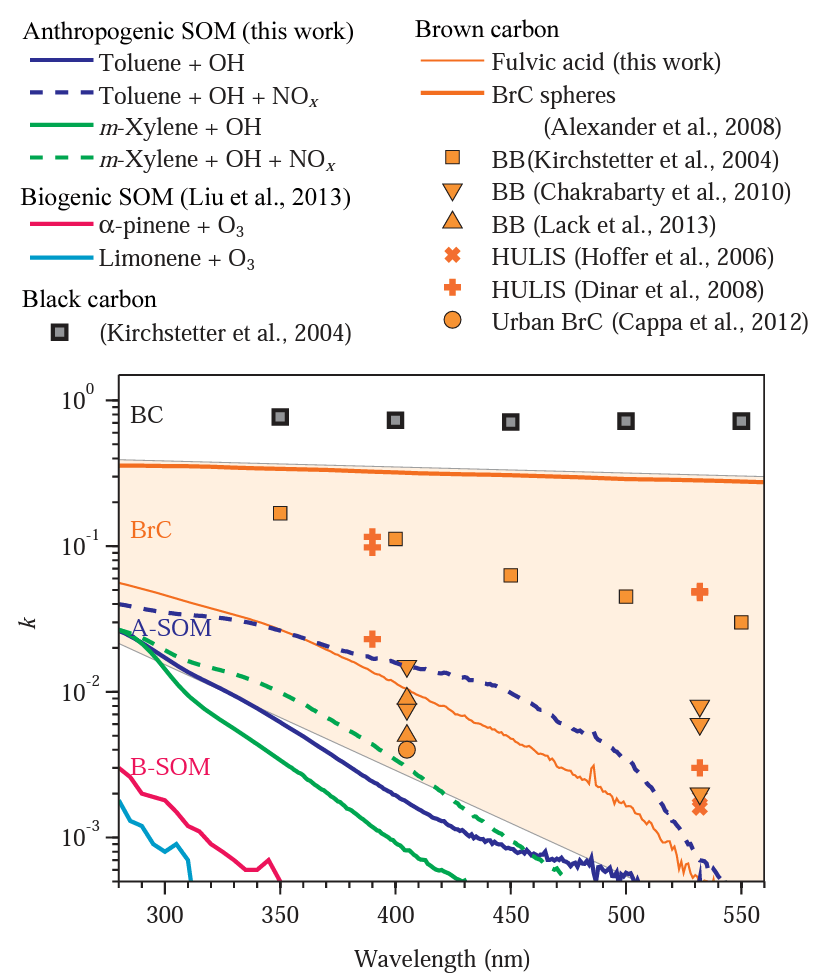
Dr. Liu developed a method to measure the spectroscopic complex refraction indices (m = n + ik) for thin films of secondary organic aerosol (SOA) material using ellipsometry and UV-VIS spectrophotometry. This method has been applied to measure the optical constants of SOA derived from ozonolysis of alpha-pinene, limonene, and catechol [Liu et al., ES&T 2013] and photooxidation of toluene and m-xylene [Liu et al., ACP 2015]. This method was also applied to two pure compounds (squalane and nigrosin) for method validation purpose. The datasets cover the wavelengths ranged from 220 nm to ~1000 nm.
These datasets have been included in the new version of high-resolution transmission molecular absorption (HITRAN2020) database (https://hitran.org/; see Gordon et al., 2022). These datasets were also used in many aerosol studies, such as a recent publication in Science [Corral Arroyo et al., Science 2022].
Tabulated datasets can be found in the link below:
https://github.com/pengfeiliu371/OA_refractive_index/
Citations:
Liu, P., Zhang, Y., and Martin, S. T.: Complex refractive indices of thin films of secondary organic materials by spectroscopic ellipsometry from 220 to 1200 nm, Environ. Sci. Technol., 47, 13594-13601, 2013.
Liu, P., Abdelmalki, N., Hung, H. M., Wang, Y., Brune, W. H., and Martin, S. T.: Ultraviolet and visible complex refractive indices of secondary organic material produced by photooxidation of the aromatic compounds toluene and m-xylene, Atmos. Chem. Phys., 15, 1435-1446, 2015.

Water diffusivity in SOA material
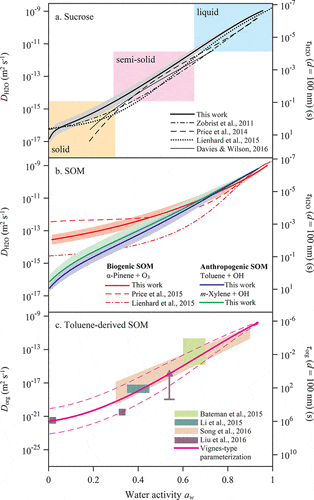
We measured water desorption kinetics of SOA thin films using a Quartz Crystal Microbalance (QCM), and retrieved water diffusivity in SOA material using a concentration-dependent multi-layer diffusion model [Liu et al., ACS Cent. Sci. 2018]. This method was validated using amorphous sucrose, and the results were consistent with literature. Tabulated data for sucrose and SOA materials derived from alpha-pinene, toluene, and m-xylene can be found in the link below:
https://github.com/pengfeiliu371/Liu_ACSCentSci_2018
Citation:
Liu, P., Li, Y. J., Wang, Y., Bateman, A. P., Zhang, Y., Gong, Z. H., Bertram, A. K., Martin, S. T.: Highly viscous states affect the browning of atmospheric organic particulate matter, ACS Central Science, 4(2), 207–215, 2018.

Reconstructed biomass burning black carbon emissions from 1750 to 2010 using ice core records and inverse modeling
We reconstruct two gridded datasets of global biomass burning emissions from 1750 to 2010 using inverse analysis with 31 ice core black carbon records as observational constraints and two different historical emission inventories as a priori estimates. The emission-deposition sensitivities are simulated by the chemical transport model GEOS-Chem. The dataset BB4CMIPpost (using BB4CMIP as a priori biomass burning emissions, Van Marle, Margreet JE, et al., Geosci Model Dev. 2017) is on a 0.25°×0.25° grid. The dataset LPJ-LMfirepost (using LPJ-LMfire emissions as a priori biomass burning emissions, Liu et al., Sci. Adv. 2021) is on a 0.5°×0.5° grid. Emissions of BC are publicly available and ready for model simulations. Emissions of other species (CH4, CO, H2, N2O, NH3, NMVOCs, NOx, OC, and SO2) are available upon request.
Citations:
Zhang, B., Liu, P., 2024, Reconstructed Black Carbon Emissions from 1750 to 2010 using Ice Core Records and Inverse modeling, https://doi.org/10.7910/DVN/KB0ESS, Harvard Dataverse, V1
Zhang, B., Chellman, N. J., Kaplan, J. O., Mickley, L. J., Ito, T., Wang, X., Wensman, S. M., McCrimmon, D., Steffensen, J. P., McConnell, J. R., & Liu, P.* (2024). Improved biomass burning emissions from 1750 to 2010 using ice core records and inverse modeling. Nature Communications, 15(1), 3651. https://doi.org/10.1038/s41467-024-47864-7


